
Lab 3: Heart Rate, Blood Pressure, and Vagal Tone: The relationship between personality and vagal Tone
Background
Vagal tone, a measure of parasympathetic nervous system activity through the vagus nerve, is thought to be linked to personality traits and emotional regulation.
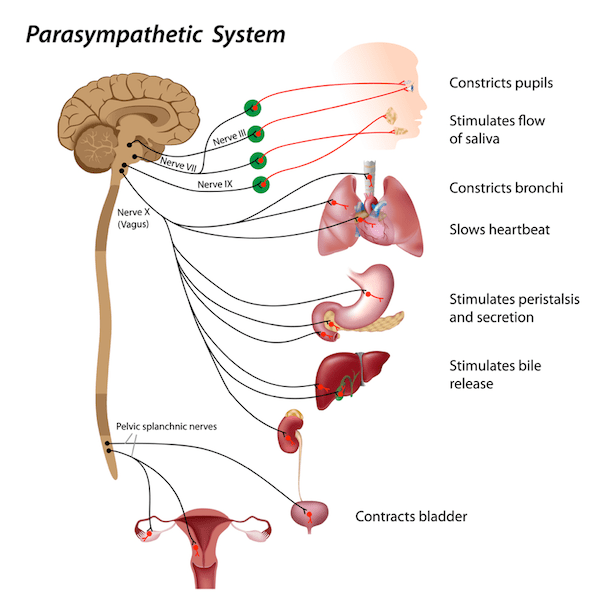
Personality is defined as a set of behavioral traits that tend to be correlated with one another and for humans, define their character. For animals, some examples of personality traits include individuals who tend to be more bold, risk-prone, and impulsive, while others within the same species or a population of species may tend to be, in contrast, more shy, risk-averse, and have higher levels of self-control.
Previous research has shown that individuals with higher vagal tone tend to exhibit greater resilience, better emotion regulation, and stronger social bonds, while those with lower vagal tone may be more susceptible to anxiety, depression, and difficulties with emotional control. Each of these traits can prove to be beneficial depending upon the environment you are living in. For example, if food is scarce or there is a stressful environment in general, then it is beneficial to be more impulsive and have less self-control, as well as being more cautious with higher levels of anxiety.
Exercise 1: Personality and Vagal Tone
Aim: To test a hypothesis that persons with high perceived shyness and behavioral inhibition have lower Vagal tone than persons with low perceived shyness. Vagal tone is measured as the difference between the maximum and minimum heart rates of the subject during normal breathing.
Start the Software
- Click on the LabScribe shortcut on the computer’s desktop to open the program. Note: when you open the LabScribe software, you may have to select iwx214 (first choice) for the hardware.
- On the Main window, pull down the Settings menu and select Personality-Vagal Tone under the Human Psychophysiology menu.
- After a short time, LabScribe will appear on the computer screen as configured by the Personality- Vagal Tone settings.
Set up
- Wrap the elastic belt of the respiration monitor around the subject’s chest at a level that is below the sternum. Place the sensor inside the belt so that the sensor is in the center of the chest at a level that is even with the subject’s elbows.
- Wrap the pulse plethysmograph around the subject’s right hand middle finger.
Procedure
- Instruct the subject to sit quietly and breathe normally before and during the recordings to prevent the creation of motion artifacts. The subject should sit erect so that the muscles involved in pulmonary ventilation are able to move without restriction.
- Type Normal Breathing <Subject’s Name> in the Mark box to the right of the Mark button.
- Click Record. Press the Enter key on the keyboard. Click AutoScale for all four channels. Record the subject’s breathing and heart rates for at least one minute.
- Click Stop to halt recording.
- Select Save in the File menu.
Data Analysis
- Scroll through the data file and find the recording of the subject’s heart and breathing rates while breathing normally. Note: when you open the LabScribe software, you may have to select iwx214 (first choice) for the hardware.
- Use the Display Time of the Main window to show an artifact-free section of data containing five breath cycles in the Main window. This section of data can also be selected by:
- Placing the cursors on either side of the section of data needed.
- Clicking the Zoom between Cursors button on the LabScribe toolbar to expand the segment of data to the width of the Main window.
3. Click on the Analysis window icon in the toolbar (Figure HP-5-L3) or select Analysis from the Windows menu to transfer the data displayed in the Main window to the Analysis window.
 Figure HP-5-L3: LabScribe toolbar
4. Look at the Function Table that is above the uppermost channel displayed in the Analysis window. The mathematical functions that are listed should include Value1, Value2, V2-V1, T2- T1, Max, Min, and Mean. The values for these parameters from each channel are seen in the table across the top margin of each channel.
5. Once the cursors are placed in the correct positions for determining the maximum, minimum, and mean heart rates, these rates can be recorded in the on-line notebook of LabScribe by typing the names and values directly into the Journal.
6. To use the Journal: The functions in the channel menus of the Analysis window can also be used to enter the names and values of the parameters from the recording to the Journal. To use these functions:
- Place the cursors at the locations described below (step 4) to measure the Heart and Ventilation Rates.
- Transfer the names of the mathematical functions used to determine the heart and/or ventilation rates to the Journal by right clicking in the correct channel from which you are gathering the data and selecting the ‘Add Title to Journal’ function in the menu. This will provide the channel titles to correspond to data.
*NOTE: If you would like the unit of measure to be added to your table, you must click on the Add function Button and select ‘unit’ for it to show up.
- Transfer the values for specific channels, such as heart and ventilation rates to the Journal by right clicking and selecting the ‘Add Ch. Data to Journal’ function in the menu. This will copy the data for specific channels to your journal.
- To copy all data gathered, right click and select ‘Add all Ch. Data to Journal’ function in the menu. This will copy all data from all channels to the journal.
**NOTE: The data copied and pasted thus far is under the ‘table’ icon and is not in the final journal format. To place all data from the table into the journal, select all data by right clicking and coping selection, click on Editor Button (next to table button) and paste in the document.
7. On the Respiration channel, click and drag one cursor to the beginning of the first breath cycle displayed in the Analysis window (Figure HP-5-L1). Drag the other cursor to the beginning of the second breath cycle and measure the following:
a. Maximum Heart Rate. The value for Max on the Heart Rate channel is the subject’s maximum heart rate during the first breath cycle.
b. Minimum Heart Rate. The value for Min on the Heart Rate channel is the subject’s minimum heart rate during the first breath cycle.
c. Mean Heart Rate. The value for Mean on the Heart Rate channel is the subject’s mean heart rate during the first breath cycle.
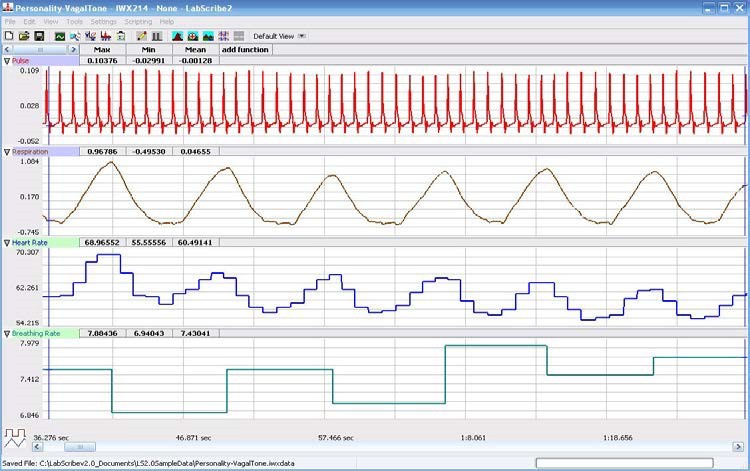
Figure HP-5-L1: The pulse wave, respiration, heart rate, and breathing rate recordings of a subject using abdominal breathing while at rest are displayed, from top to bottom, in the Analysis window. On the respiration channel, inhalation is displayed as an upsweep. Notice that the heart rate goes up during inhalation.
8. On the Respiration channel, leave one cursor at the beginning of the second breath cycle. Click and drag the other cursor to the beginning of the third breath cycle displayed in the Analysis window.
9. Repeat Steps 7 and 8 for the second breath cycle.
10. Move the cursors to the beginning and end of each of the three remaining breath cycles and repeat Steps 7 and 8 for each breath cycle
11. Determine the means of the maximum and the minimum heart rates for the five breaths. Enter these values in Table HP-5-L1.
Table HP-5-L1: Heart Rate Variation during Normal Breathing
|
|
||||
|
|
Heart Rate (BPM) |
Breath Rate (BrPM) |
||
|
Subject |
Max |
Min |
∆ |
|
|
Breath 1 |
|
|
|
|
|
Breath 2 |
|
|
|
|
|
Breath 3 |
|
|
|
|
|
Breath 4 |
|
|
|
|
|
Breath 5 |
|
|
|
|
|
Mean |
|
|
|
|
12. Determine the difference (∆) between the mean maximum and mean minimum heart rates and enter this value in Table HP-5-L1. This difference, which will be used to measure Vagal tone, is also known as the respiratory sinus arrhythmia (RSA) prominence.
13. On the Respiration channel, click and drag one cursor to the beginning of the first breath cycle. Click and drag the other cursor to the end of the fifth breath cycle displayed in the Analysis window and measure the Mean Breath Rate. The value for Mean on the Breath Rate channel is the subject’s mean breath rate over the five consecutive breath cycles.
14. Record the value for this rate in the Journal using one of the techniques described in Exercise 1, and in the data table.
15. Have the subject answer the questions in the shyness/behavioral inhibition questionnaire in Table HP-5-L2.
Step 2: Enter the data you have collected into a provided excel spreadsheet that is located on the computer, at the front of the room, to compile the class data.
Use the SPSS software on the lab computer and obtain the completed datasheet and run a spearman rank correlation analysis between personality score and the mean difference in the min and max heart rate (Vagal tone), as well as the personality score, and the breath rate. Make two different X,Y correlation plots with the r value and and p-value being presented on the plot from your spearman rank correlation.
Step 3: use the following questions below and the analysis above to generate result statements and a corresponding concluding paragraph that interprets these results based on the class results obtained. These will be turned in for grading as a lab report.
Questions
- What is the value for the Vagal tone of the subject? What percentage of the mean minimum heart rate is the value for the Vagal tone?
- How does the Vagal tone of this subject compare to the subject’s score on the shyness/behavioral inhibition questionnaire?
- How does the Vagal tone of this subject compare to those of other subjects? When the Vagal tones and shyness scores of all the subjects are compared, is there a correlation between shyness/behavioral inhibition and Vagal tone?
- Does any other factor besides shyness or inhibition affect Vagal tone?
HP-5-L2: Shyness/Behavioral Inhibition Questionnaire*
| Question | |
| How often do you experience awkwardness or discomfort in the following situations? | Score (0-4) |
| 1. At a party | |
| 2. On a dinner date | |
| 3. In a class discussion when expected to contribute | |
| 4. In an uncrowded elevator | |
| 5. When introduced to someone | |
| 6. In a study group | |
| 7. When asked to introduce yourself in class | |
| 8. When asking someone out for coffee (tea, soda, etc.) | |
| 9. When asking for notes from a classmate after an absence | |
| 10. When speaking to a professor | |
| How often do you have difficult actually doing (taking action on) the following? | Score (0-4) |
| 11. Making and sustaining eye contract in a conversation. | |
| 12. Initiating a conversation with persons you do not know well. | |
| 13. Disagreeing with someone. | |
| 14. Asking a question in class. | |
| 15. Making small talk. | |
| 16. Asking directions or help. | |
| 17. Calling people on the phone to invite them over. | |
| 18. Giving aide or attention to someone in distress. | |
| 19. Seeking information from others about class assignments | |
| 20. Telling someone he or she is bothering you. | |
| TOTAL | |
| *Ratings: 0 = never, 1 = rarely, 2 = occasionally, 3 = often, 4 = almost always. The total score is the sum of the ratings for all 20 questions. |
References
Cole, P. M., Zahn-Waxler, C., Fox, N. A., Usher, B. A., & Welsh, J. D. (1996). Individual Differences in Emotion Regulation and Behavior Problems in Preschool children. Journal of Abnormal Psychology, 105(4), 518-529.
Eisenberg, N., Fabes, R. A., Karbon, M., Murphy, B. C., Carlo, G., & Wosinski, M. (1996). Relations of School Children’s Comforting Behavior to Empathy-related Reactions and Shyness. Social Development, 5(3), 330-351.
Harris, R. M., Porges, S. W., Carpenter, M. E., & Vincenz, L. M. (1993). Hypnotic Susceptibility, Mood State, and Cardiovascular Reactivity. American Journal of Clinical Hypnosis, 36(1), 15-25.
Jemerin, J. M. & Boyce, W. T. (1990). Psychobiological Differences in Childhood Stress Response. II. Cardiovascular Markers of Vulnerability. Journal of Developmental Behavioral Pediatrics, 11(3), 140- 150.
Kagan, J., Reznick, J. S., & Snidman, N. (1987). The Physiology and Psychology of Behavioral Inhibition in Children. Child Development, 58, 1459-1473.
Lane, J. D., Adcock, R. A., & Burnett, R. E. (1992). Respiratory Sinus Arrhythmia and Cardiovascular Responses to Stress. Psychophysiology, 29(4), 461-470.
Porges, S. W. (1992). Vagal tone: A Physiological Marker of Stress Vulnerability. Pediatrics, 90(3), 498-504.
Thayer, J. F., Friedman, B. H. & Borkovec, T. D. (1996). Autonomic Characteristics of Generalized Anxiety Disorder and Worry. Biological Psychiatry, 39(4), 255-266.