
Lab 9: Defense Mechanism – Mouse Defense Behavior
Materials needed for mouse behavior lab activity (lab to be held in Rm SE 2010):
Mice (24 of two different strains, Cb2F, S129, one at a time for each lab section)
4 Mouse running wheel (1 per group)
4 Timers (1 per group) (students may use their cell phones)
24 Confinement containers (50 ml Falcon tubes with holes) for inducing stress
Nitrile gloves
4, 70% cleaning ethanol in spray bottles
4 Very large forceps
4 Black Sharpie markers
Paper towels
Background
Defense mechanisms can include physiological (immune system and integument system) as well as behavioral mechanisms that can be impacted by underlying physiological mechanisms. Mice are powerful model organisms used in neurological research to understand how altered physiological states respond to their environment.
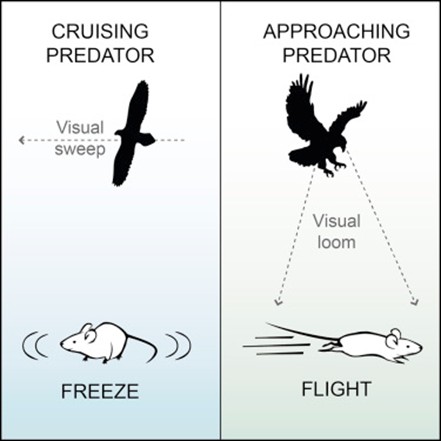
Mouse defensive behavior consists of instinctive, hierarchical, and context-dependent responses to threats, primarily including freezing, fleeing (flight), hiding, and risk assessment (scanning/stretching). Mice select behaviors based on threat proximity—freezing when a threat is distant and fleeing when it is near. These, along with defensive attacks or, in the case of females, nest defense, are essential survival mechanisms.
Core Defensive Behaviors
- Freezing/Immobility: A low-level, initial response to danger when no immediate escape route is apparent, or as a way to avoid detection.
- Flight/Escape: A rapid movement toward a, often previously memorized, safe location or burrow.
- Hiding: Retreating to a secure, enclosed area.
- Risk Assessment: Behaviors used to gather information about a threat while minimizing detection, such as “stretched-approach” postures, freezing, scanning, and sniffing.
- Defensive Aggression: Threatening, chasing, or biting (often during a resident-intruder scenario).
- Defensive Upright Posture: A common, non-aggressive posture adopted during close-range, high-intensity confrontations, usually by a subordinate or intruder mouse.
Factors Influencing Defense
- Threat Type: Visual, auditory, and olfactory cues (e.g., predator odors) can all trigger defensive responses.
- Experience & Learning: Mice can update their defensive strategies, such as changing from escape to freezing based on spatial memory, in a single, short experience.
- Strain Differences: While basic mechanisms are similar, wild mice tend to show faster, more pronounced flight/freezing, whereas laboratory mice (e.g., Swiss mice) often display higher levels of risk assessment.
Stress can have a multitude of effects on defensive behaviors. In some contexts, anxiety-related behavior may cause a mouse to become less active and more cautious, while in other contexts, the mouse may become more flighty and be more likely to initiate the flight response.
Lab activity objective
Today, you will investigate the effects of stress on the evasive running defense behavior in mice that can impact the overall level of activity using two different mouse strains housed and maintained right here at William Paterson University by Emmanuel S. Onaivi, PhD and Tiana Vacca.
Cx3Cr1-Cnr2 and DAT-Cnr2 mice strain is a conditional knockout (cKO) mouse strains used to study cannabinoid receptor 2 (CB2R) function in microglia and dopamine neurons, respectively. DAT-Cnr2 mice exhibit spontaneous hyperactivity, increased impulsivity, and altered alcohol/cocaine responses. Cx3Cr1-Cnr2 mice are used to study neuroimmune responses, such as those in alcohol consumption.
S129 mouse strain is frequently used in autism research as a control or genetic background strain, exhibiting high anxiety, social deficits, and repetitive behaviors. They are often used in neurodevelopmental studies, alongside modified strains (like Shank3B) that model specific autism spectrum disorder (ASD) features, including social deficits, excessive grooming, and impaired communication.
Procedure
Step 1: Learn first how to properly handle the mice to avoid them biting or escaping from your hands and to minimize induced stress from handling. In order to do this you will grab them by the distal end of the tail and avoid putting your other hand around where their mouth is.
Note: show me your handling techniques before you start handling the mice. Make sure the water bottle is on top of the cage so the mice cannot escape!
Step 2. Each group will obtain a total of 6 mice from one of the two strains (Cb2F, SI29).
Step 3. We will have before and after treatment groups for this experiment for each strain. First, we will need to obtain the baseline or before treatment activity level.
In order to accomplish this, first note what number is present on the running wheel and record this. Make sure that the you or the mouse does not induce movement on the wheel after this.
Pick up one mouse and then label it using a black sharpie marker with a dot numbering system (one, two, three, four, five, or six dots), so you will be able to recover this same individual after the stress treatment.
One at a time, place a mouse in the running wheel by the tail and immediately close off the wheel so that the mouse does not escape.
Immediately start the timer and record how many revolutions occur in a 5-minute time period.
Note: In your datasheet you will need to keep track of the before or after measurement, the strain, and the sex of the mouse (male or female).
Step 4. After 5 minutes, grab the mouse by the tail once again using large forceps, place the mouse back into its cage. Make sure to hold the wheel so you get an accurate number of revolutions in 5 minutes!
Step 5. Spray the running wheel with 70% ethanol and wipe it down using a paper towel. This is a standard procedure to remove any scent from the previous mice being used.
Step 6. Then place the next mouse into the running wheel by the tail and repeat the procedure until all six mice are measured.
Step 7. Place all mice in the 50 mL Falcon tube with holes stress tubes, one mouse goes into one tube for 1 hour.
Step 8. After the stress test of 1 hour, measure the running activity in a 5-minute period once again for all of the mice, one at a time, this constitutes the after measurement.
Step 9. Compile the data as a class in an excel sheet and conduct a paired t-test to determine if there are any significant differences across the before and after treatment groups.
Make a bar graph with error bars to compare before and after the stress treatment to visualize the results obtained. Write a results statement and a concluding paragraph the interprets your results. All of this should be turned in as part of your lab report.