5 Urinary System
Learning Objectives
- Identify the organs of the urinary system.
- Identify the functions of the urinary system.
- State the function of each organ of the urinary system.
- Identify the parts of a kidney.
- Identify the parts of the nephron.
- Explain the three steps in urine formation and how they relate to the parts of a nephron.
- Determine the characteristics of urine through urinalysis and relate them to different health conditions.
URINARY SYSTEM
The urinary system is composed of the paired kidneys and the urinary tract, which includes two ureters, the bladder, and a urethra (Figure 5.1). The principal function of the urinary system is to maintain the volume and composition of bodily fluids. This is accomplished by the kidneys filtering the blood to remove metabolic wastes, such as carbon dioxide and nitrogenous wastes including urea, ammonium, creatinine, and uric acid, and then modifying the resulting fluids to produce urine. The goal is to maintain homeostasis of electrolytes, acid-base balance, and blood pressure. The urinary system maintains the appropriate fluid volume in the body by regulating the amount of water excreted in the urine. Through its functions the concentrations of various electrolytes and normal pH of the blood are controlled.
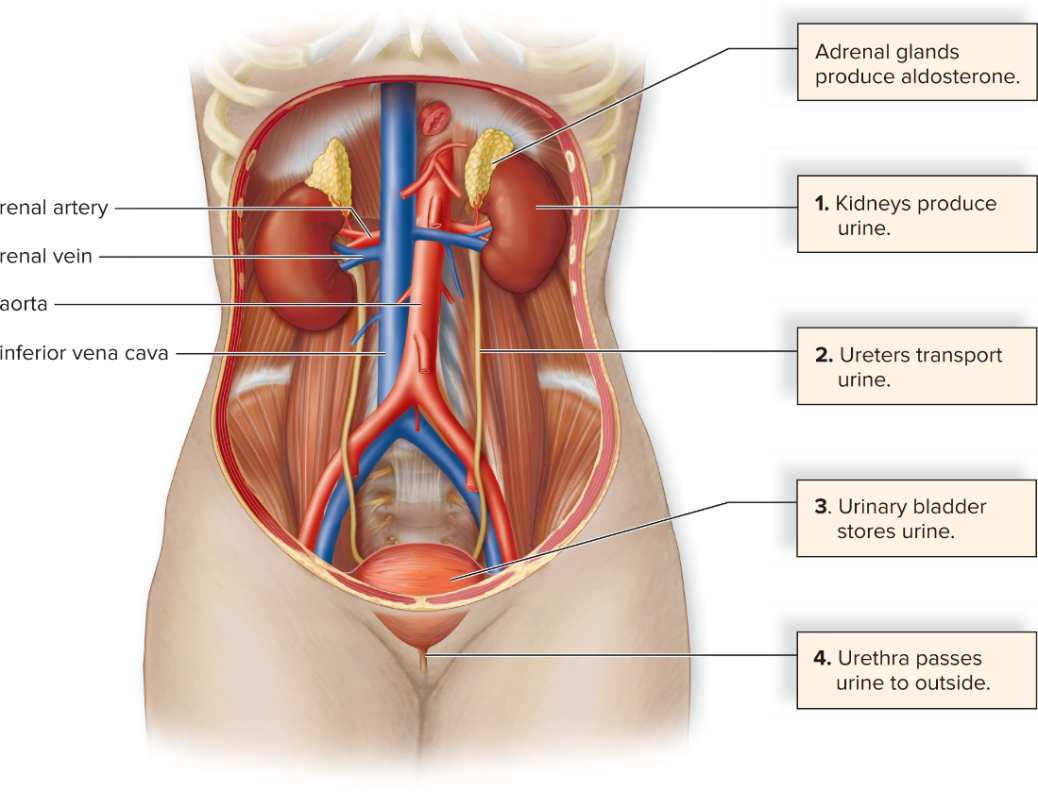
Figure 5.1: Organs of the urinary system in a female. © McGraw Hill Education
The kidneys also play a role in the endocrine system in hormone secretion by releasing the enzyme renin that leads to production of aldosterone, which is released by the adrenal glands, structures that lie atop the kidneys. Aldosterone is involved in regulating the water-salt balance in the blood. The kidneys have an additional role in the endocrine system, regulating the production of red blood cells by releasing the hormone erythropoietin.
The functional unit of the kidney is the nephron. It consists of tubules that filter blood and produce urine. The kidney is divided into two main regions: renal cortex (outermost section of the kidney that contains the majority of the nephron structure) and renal medulla (inner region of the kidney that contains renal pyramids, consisting of the loops of nephrons and collecting ducts). The renal pelvis is where urine is received from the collecting ducts of nephrons and conducted to the ureters and then the urinary bladder. (Figure 5.2)
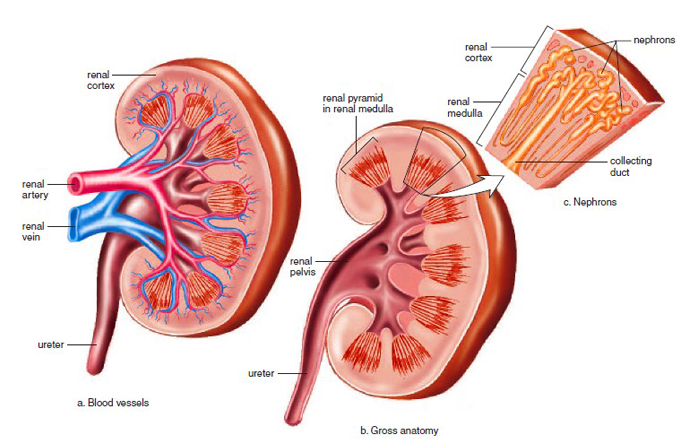
Figure 5.2: The longitudinal section of a human kidney. (a) This image shows the branching of the renal vein and renal artery into smaller venules and arterioles, and how they surround the nephrons. (b) An enlargement showing the placement of the nephron among the renal cortex and renal medulla of the kidney in order for the urine to empty out into the renal pelvis by way of the collecting duct. (c) By a combination view of (b) and (c) it can be seen where the nephron is located inside the kidney structure as a whole and how the urine is transferred to the ureter.
The nephron consists of the following structures (Figure 5.3):
- Glomerular capsule: a group of large-pored capillaries that carry out glomerular filtration. This is where substances move from the blood to inside the nephron.
- Proximal convoluted tubule: region of the nephron lined with many microvilli that allows for tubular reabsorption to occur, where substances move from the nephron back into the blood.
- Loop of nephron: This portion of the nephron narrows in diameter and forms a U-shaped portion. It functions in water reabsorption.
- Distal convoluted tubule: This region of nephron lacks microvilli and the primary function is ion exchange. The process of tubular secretion is carried out, where substances move from blood to inside the nephron, specifically the collecting duct.
- Collecting duct: located in the renal medulla, carries urine from distal convoluted tubules of several nephrons to the renal pelvis, and functions in water reabsorption.

Figure 5.3: An overview of urine production. The three main processes in urine formation are described in boxes and color-coded to arrows that show the movement of molecules into or out of the nephron at specific locations. In the end, urine is composed of the substances within the collecting duct (see brown arrow). © McGraw Hill Education
URINALYSIS
Urinalysis can indicate whether the kidneys, liver, or other urinary organs are functioning properly or whether an illness such as diabetes mellitus is present. The following are some commonly measured characteristics of urine and possible pathologies associated with them.
- Volume: One to 2 liters of urine are produced every 24 hours, but amounts vary considerably both within and among individuals
- Color: The color of urine is due to a pigment called urobilin (or urochrome). Urobilin is the breakdown product of hemoglobin and bile pigments. The color varies from pale yellow to deeper amber depending on the concentration of urobilin. The deeper amber color the urine, the more concentrated is the urobilin. Abnormal urinary color may be due to eating certain foods, such as beets, some vitamins, medications, the build up of bile, infection, or blood abnormalities.
- Odor: Normal, healthy urine does not have a strong smell, but with dehydration, urine odor may have a stronger ammonia-like smell. Urine from a person with a urinary tract infection has an ammonia-like odor or simply foul odor. Certain foods and medications can affect the odor. Urine of a person with diabetes can have a sweet, or fruity, odor.
- pH: Normal urine pH tends to be 6.0 to 7.5 but can range from 4.5 to 8.0. pH may vary based on diet. For example, a vegetarian diet usually results in an alkaline pH (higher in number), whereas a high protein diet makes the urine more acidic (lowers pH). A bacterial infection, antacids, ulcers, and alkaline drugs can affect the pH. Alkaline urine is one indicator of kidney stones produced by bacterial infection.
- Specific gravity: Specific gravity is the ratio of the density of a substance to the density of a standard such as water. The specific gravity of urine gives a rapid indication of the concentration of solutes present in the urine. The range of normal urine falls between 1.002 and 1.030 based on whether the kidneys are functioning correctly, fluid intake, diet, and medication. The higher the number, the more dehydrated the person may be, due to more solutes in the urine. Urine samples collected in the morning usually have the highest specific gravity. Excessive amounts of water, use of diuretics, and patients with diabetes insipidus or chronic renal failure may have urine with lower specific gravity.
- Red blood cells: Normal, healthy urine should not contain red blood cells as red blood cells are too large to pass through glomerulus filtration. If red blood cells are present in the urine, they may be a sign of a condition called hematuria, where the urinary tract has become irritated or kidney stones are present. There also could have been physical trauma to the urinary organs. In healthy menstruating females the presence of blood cells in the urine could be due to the urine sample being contaminated with menstrual.
- Hemoglobin: The presence of hemoglobin in the urine is a result of the breakdown of red blood cells, where hemoglobin released into the plasma of the blood is filtered by the kidneys. Hemoglobin in the urine can cause urine to have a purple color. Hemoglobinuria may indicate hemolytic anemia, transfusion reactions, or renal disease.
- White blood cells: The presence of white blood cells indicates possible infection in the kidney or other urinary organs. This infection is referred to as pyelonephritis.
- Protein: The blood protein albumin is the most abundant and smallest of plasma proteins. Its function is to maintain osmotic pressure of the blood. Proteins like albumin are usually found in small amounts because they are too large to pass through the pores in the glomerulus capillaries, but under certain conditions, such as strong physical exertion and diet extremely high in protein they can increase in concentration. These situations are nonpathological conditions. Causes of pathological conditions of albuminuria are increased blood pressure, increase in the permeability of filtration membrane due to injury or disease, or irritation of kidney cells by substances such as bacterial toxins, ether, or heavy metals.
- Nitrite: Bacterial infections of the urinary tract are typically caused by Gram negative bacteria, which convert dietary nitrate to nitrite.
- Glucose: Glucose is not normally present in the urine except for trace amounts. Glycosuria, the presence of glucose in the urine, usually indicates diabetes mellitus in which the body cells are unable to absorb glucose from the blood. Excessive glucose in the blood leads to exceeding the glucose threshold of the kidneys, and spillover of blood glucose into the urine. Glycosuria also occurs from excessive carbohydrate intake.
- Ketones: Ketonuria is when the urine contains high levels of ketones, such as acetone. This symptom may indicate diabetes mellitus, anorexia, starvation, or simply too few carbohydrates in the diet. When the body does not have or use glucose due to starvation or diabetes mellitus (lack of insulin), the body breaks down fat instead of glucose for energy and that process results in higher levels of ketones. Ketones are acidic, so if too much accumulates, blood pH becomes acidic, which is dangerous.
- Urobilinogen & Bilirubin: The presence of urobilinogen and bilirubin in the urine in high concentrations indicates liver disease such as cirrhosis or gall stones. If there is little to no urobilinogen in the urine, it can mean that the liver isn’t working correctly.
- Nitrogenous waste compounds: Urea, uric acid, and creatinine are the most important nitrogenous wastes found in urine. Urea makes up 60-90% of nitrogenous material in urine and is derived from ammonia produced during protein breakdown. Uric acid is a metabolite of nucleic acid breakdown. Because it is insoluble, uric acid tends to crystallize and is a common component of kidney stones. Creatinine, a normal constituent of blood, is derived from the breakdown of creatinine phosphate in muscle tissue.
- Inorganic compounds: Sodium ions appear in relatively high concentration in the urine because of reduced urine volume, not because large amounts are being secreted. Sodium is the major positive ion in the blood plasma; under normal circumstances, most of it is actively reabsorbed. Much smaller but highly variable amounts of calcium, magnesium, and bicarbonate ions are also found in the urine. Abnormally high concentrations of any of these urinary constituents may indicate a pathological condition (disease).
Note to students: Write all data and answers to questions on the Lab Report provided.
Activity 1: Determine the color and transparency of each urine sample.
Urine color and transparency can indicate hydration levels, consumption of vitamins, medications, foods, and health conditions. For example, pale, clear yellow is the normal color for hydrated people whereas dark yellow or amber may indicate dehydration. If the urine sample is cloudy or frothy, it may be an indication of the presence of excess proteins, mucus, sperm, urine crystals, or blood cells.
Record the color and transparency of each urine sample in Table 5.1 and Table 5.7 of the Lab Report.
Activity 2: Determine the pH of each urine sample.
Obtain a strip of wide range pH paper to determine the pH of each urine sample. Use a fresh strip of pH paper for each sample. Dip the strip into the urine to be tested two or three times before comparing the color obtained with the chart on the pH dispenser. Do not wait too long because the color will change.
Record the pH of each urine sample in Table 5.2 and Table 5.7 of the Lab Report.
Activity 3: Determine the presence of ketones in each urine sample.
Open each urine sample cup, and using a wafting motion, (waving your hand over the cup without bringing the cup directly to your nose), notice the odor of each urine sample. Do any samples smell like nail polish remover (acetone/ ketone)?
Record the presence of ketones of each urine sample in Table 5.3 and Table 5.7 of the Lab Report by describing the odor.
Activity 4: Determine the presence of glucose in each urine sample.
Label three test tubes: one test tube A, one test tube B, and one test tube C. Place the test tubes into a test tube rack. Add 5 ml of the corresponding urine sample to each test tube (Example: Add 5 ml of urine sample A into test tube A). Add 10 drops of Benedict’s solution into each test tube. Then, place all test tubes into a boiling water bath (beaker on a hot plate). Let them sit for 3 minutes. Using a test tube holder, remove from boiling water bath, and return to test tube rack.
Record the color change in Table 5.4 and Table 5.7 of the Lab Report.
(In general, blue to blue-green or yellow-green is negative, yellowish to bright yellow is a moderate positive for glucose, and bright orange (or red) is a very strong positive for glucose.)
Activity 5: Determine the presence of protein in each urine sample.
Label three test tubes: one test tube A, one test tube B, and one test tube C. Place the test tubes into a test tube rack. Add 5 ml of the corresponding urine sample to each test tube (Example: Add 5 ml of urine sample A into test tube A). Then, add 25 drops of Biuret’s reagent into each test tube. Pick up each tube, one at a time, out of the test tube rack and swirl it around to mix the Biuret’s reagent with the urine sample.
Record the color change in Table 5.5 and Table 5.7 of the Lab Report.
(In general, if there is no change in color and it remains blue, it is negative; if the solution turns from blue to violet (deep purple) or blue to pink, then it is positive for proteins.)
Activity 6: Determine the presence of chloride in each urine sample.
Label three test tubes: one test tube A, one test tube B, and one test tube C. Place the test tubes into a test tube rack. Add 5 ml of the corresponding urine sample to each test tube (Example: Add 5 ml of urine sample A into test tube A). Add 4 drops of silver nitrate (AgNO3).
Record if a white precipitate forms or not in Table 5.6 and Table 5.7 of the Lab Report.
(If a white precipitate forms, it is positive for chloride.) Enter + for positive and – for negative test.
Activity 7: Use of multi-test strips to determine various characteristics of each urine sample.
- Obtain three urine test strips. Label the longer end of the test strips: one test strip A, one test strip B, and one test strip C. Dip test strip A in urine sample A. Be sure that the chemically treated patches on the test strip are totally immersed briefly (no longer than 1 second).
- Draw the edge of the strip along the rim of the specimen container to remove excess urine.
- Turn the test strip on its edge and tap the edge once horizontally on a piece of paper towel to remove any remaining urine to prevent any possible mixing of the chemicals.
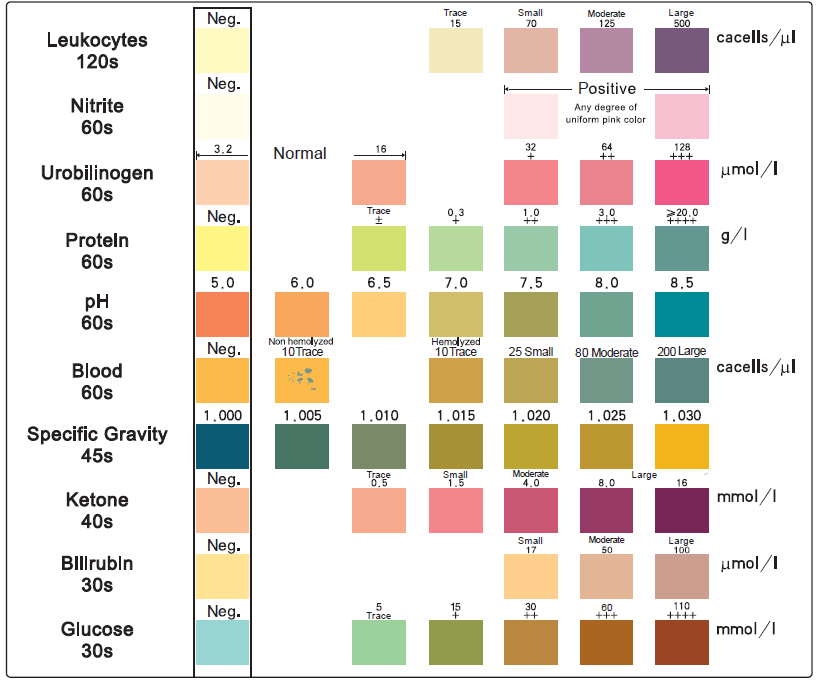
After at least 60 seconds, read the results of the test strips by comparing each one to the following diagnostic color chart. Record results in Table 5.8 of the Lab Report. - Test the other two urine samples according to the previous directions.
Activity 8: Urinalysis Results and Lab Review
On the Lab Report, answer the questions under the Urinalysis Results and Lab Review.
Link to Lab Report: Lab 5 Urinary System Lab Report
REFERENCES
Amerman, Erin. C. (2016). Human Anatomy & Physiology. New York: Pearson.
Bono MJ, and Reygaert WC. Urinary Tract Infection. [Updated 2018 Nov 15]. In: StatPearls [Internet]. Treasure Island (FL): StatPearls Publishing; 2018 Jan-. Available from: https://www.ncbi.nlm.nih.gov/books/NBK470195/
Desroches, Danielle, PhD. (2011). General Anatomy and Physiology II Laboratory Manual: Section C. Wayne, NJ: William Paterson University.
Encyclopedia.lubopitko-bg. (n.d.). Anatomy of the kidney. Anatomy of a nephron. https://encyclopedia.lubopitko-bg.com/Anatomy_of_the_Kidney1.html
Lab Manual Introductory Anatomy & Physiology. (2009). Retrieved from eScience Lab, Inc: http://esciencelabs.com/files/product_pdfs/AandP-SampleLab.pdf
Leonard, Claire. PhD. (n.d.). Laboratory Manual for General Biology. Wayne, NJ: William Paterson University.
Mader, Sylvia. S. (2018). Laboratory Manual for Human Biology (15th edition). New York: McGraw Hill Education.
Onaivi, Emmanuel, PhD. and Donna R. Potacco, MS., MBA. (2005). Applied Anatomy and Physiology Laboratory Manual (2nd Edition). New York: McGraw Hill Learning Solutions.
